How to calculate OEE, with a worked example and the usual mistakes
OEE (Overall Equipment Effectiveness) measures how much of your planned production time actually produced good product at full speed. The formula is Availability times Performance times Quality, where Availability is run time over planned time, Performance compares actual to ideal speed, and Quality is good units over total units.
OEE answers exactly one question
Of all manufacturing metrics, OEE is among the most used and the most misread.
The question it answers is simple.
Of all the time you planned to produce, how much actually produced good product at full speed?
The answer is a single percentage.
An OEE of 100% would mean the equipment ran for all of the planned time, at its ideal rate, with every unit good.
That never happens in practice. It is not meant to.
The point of the number is to show where the lost time went.
The formula
OEE is the product of three factors.
OEE = Availability × Performance × Quality
Because they multiply, they compound.
Three factors that each look reasonable at 90% produce an OEE of 72.9%.
This is why OEE is often startling the first time it is calculated properly.
| Factor | What it measures | Formula |
|---|---|---|
| Availability | How much of the planned time it ran | Run Time ÷ Planned Production Time |
| Performance | How fast it ran against its ideal rate | (Total Count × Ideal Cycle Time) ÷ Run Time |
| Quality | How much came out good first time | Good Count ÷ Total Count |
Note that Performance uses Ideal Cycle Time, not a historical average rate.
If the benchmark is the speed you usually achieve, Performance will always sit near 100% and speed losses become completely invisible.
A worked shift
A filling line is scheduled for one 8-hour shift.
The recorded data:
- Shift length: 8 hours = 480 minutes
- Scheduled breaks: 30 minutes, so Planned Production Time = 450 minutes
- Breakdowns and changeover: 62 minutes
- Total production: 18,400 bottles
- Rejects and rework: 520 bottles
- Ideal cycle time: 0.02 minutes per bottle, or 50 bottles per minute
Availability
Run Time = 450 - 62 = 388 minutes

Availability = 388 ÷ 450 = 0.862 = 86.2%
Performance
Ideal time for 18,400 bottles = 18,400 × 0.02 = 368 minutes

Performance = 368 ÷ 388 = 0.948 = 94.8%
Quality
Good Count = 18,400 - 520 = 17,880 bottles

Quality = 17,880 ÷ 18,400 = 0.972 = 97.2%
OEE
OEE = 0.862 × 0.948 × 0.972 = 0.795 = 79.5%A quick way to check the result:
(Good Count × Ideal Cycle Time)
÷ Planned Production Time

(17,880 × 0.02) ÷ 450

= 79.5%
Read it this way.
Of the 450 minutes planned for production, the equivalent of only 358 minutes actually produced good bottles at full speed.
Roughly 92 minutes were lost. Most of it, 62 minutes, as downtime.
This is where OEE earns its place.
The figure of 79.5% on its own does not tell you what to fix.
The breakdown of where those 92 minutes went does.
The six big losses
The classic TPM framework splits losses into six categories. Each one lands on a single OEE factor.
| Factor | Loss | On the shop floor |
|---|---|---|
| Availability | Breakdowns | Conveyor motor failure, PLC fault |
| Availability | Setup and changeover | Product size change, recipe adjustment |
| Performance | Minor stops | Jammed bottle, sensor needing a reset, feeder misfeed |
| Performance | Reduced speed | Line run below rating because of vibration or wear |
| Quality | Startup rejects | First bottles after a changeover out of specification |
| Quality | Production rejects | Underfill, failed seal, misaligned label |
The two middle categories are the ones most often missing from manual calculation.
Minor stops and reduced speed are also frequently the largest losses.
Why manual OEE is almost always too high
If OEE comes from shift logs and spreadsheets, the number is nearly certain to look better than reality.
Not through dishonesty. Through how the data is gathered.
- Short stops go unrecorded. A three-minute stop to clear a jammed bottle rarely reaches a log. Twenty of those in a shift is a full hour that appears nowhere.
- Reduced speed does not feel like a loss. A line running at 42 bottles per minute against a 50 rating still looks like it is running fine. Nothing stopped, so nothing was written down.
- Downtime reasons are assigned later. Categories chosen at end of shift from memory cluster into whichever few are easiest to recall.
- The planned and unplanned boundary drifts. When changeover or cleaning migrates into planned downtime, OEE rises without anything on the floor improving.
The consequence is not merely an inaccurate number.
An inflated OEE points improvement work at the wrong place, because the largest losses are precisely the ones missing from the data.
Reading the number properly
A few things make OEE useful rather than decorative.
- Measure it at the bottleneck. A high OEE on non-bottleneck equipment just means WIP piling up in front of the real constraint.
- Fix the definitions, then leave them alone. OEE is only comparable to its own history. Redefining planned downtime makes every prior period incomparable.
- Always read the three factors, not just the product. A 70% driven by low Availability is a maintenance problem. The same 70% driven by low Quality is a process problem. They call for entirely different work.
- Treat it as a direction, not a target. Once OEE becomes something people are assessed on, the pressure to improve it through definitions almost always exceeds the pressure to improve it through process.
What changes when the data comes from the equipment
The difference between manually and automatically calculated OEE is not the formula.
The formula is identical.
The difference is which losses get recorded at all.
When state and counts are read directly from equipment over OPC UA, MQTT or Modbus TCP, short stops are captured because they happened. Not because someone had time to write them down.
Reduced speed shows up as the gap between actual and ideal cycle time, without anyone needing to notice it first.
Operators still categorise downtime reasons, but they do it while the event is fresh rather than eight hours later.
The usual result is an OEE figure lower than the one before.
That is not a drop in performance. Those losses were always there.
They are simply visible now.
Where VECHR MES fits
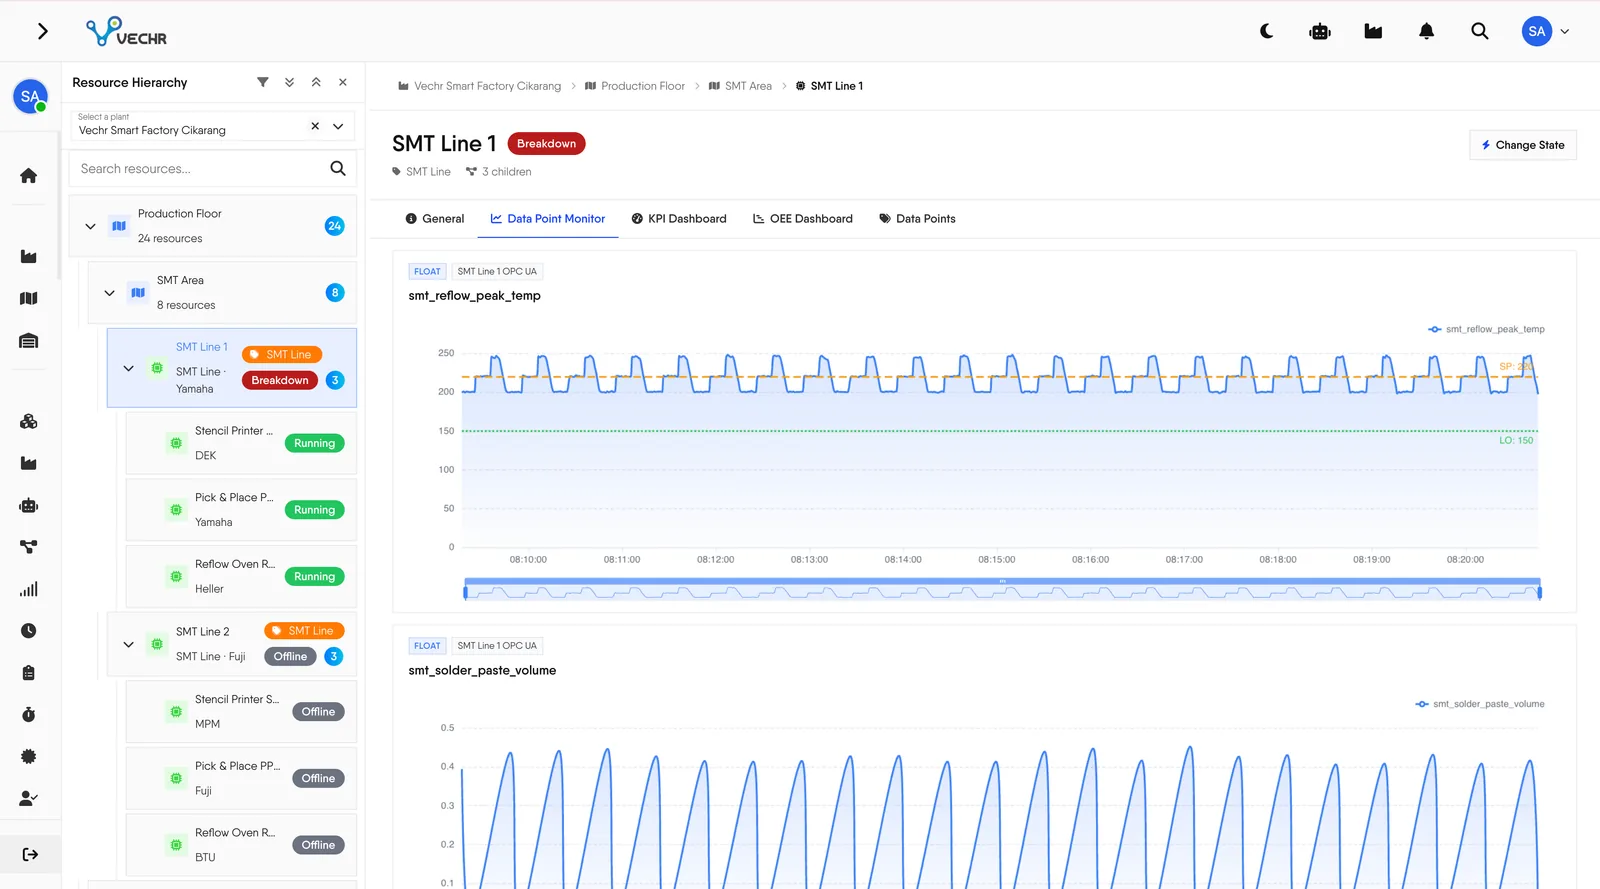
VECHR MES computes OEE continuously from data read at the resource level over OPC UA, MQTT and Modbus TCP.
Short stops and reduced speed are counted alongside major downtime rather than lost.
More than 30 standard downtime categories keep stop reasons consistent between shifts and between lines, and categorisation happens at the moment of the event.
Because OEE is calculated in the same system as production orders, materials and quality, the number stays traceable to its context. Which order was running, which product, which operator, which process step.
MTTR and MTBF derive from the same data. Maintenance history sits on the same platform, so the relationship between equipment condition and equipment performance can be read without joining separate systems.
Frequently Asked Questions
What counts as a good OEE score?
The figure of 85% is widely cited as world-class for discrete manufacturing, made up of roughly 90% Availability, 95% Performance and 99% Quality. But the number only means anything if it is calculated on consistent definitions. An honestly measured 65% is far more useful than a 92% obtained by moving losses out of the calculation.
Does planned downtime count against Availability?
No, provided the definition stays consistent. OEE is measured against planned production time, so time never scheduled for production sits outside the base. Holidays, unstaffed shifts, scheduled preventive maintenance. The problem is when categories like changeover or cleaning get reclassified as planned downtime to improve the number, since both are genuinely lost production time.
How is OEE different from TEEP and OOE?
They differ in the time base. OEE measures against planned production time. OOE also includes available but unscheduled time. TEEP measures against all calendar time, 24 hours by 7 days. TEEP answers how much capacity you still have, not how well execution is running.
Why is manually calculated OEE usually higher?
Because losses that are not recorded are effectively treated as never having happened. Short stops under five minutes rarely reach a shift log even though they add up substantially. Reduced speed is almost never recorded at all. Manual calculation typically captures only major downtime, which produces a better number than reality.
Does OEE suit every kind of production?
OEE fits best on bottleneck equipment with a clearly defined ideal speed. In processes constrained by material, labour or demand, a high OEE can mean overproduction rather than good performance. Measuring OEE on non-bottleneck equipment often drives behaviour that hurts overall flow.