Factory digitalisation: a sequence that works, not a list of technologies
Successful factory digitalisation almost always follows an order. Connect shop-floor data first, then digitise production execution, and only then build analytics and automation on top. Projects that begin with a dashboard usually fail because there is no data worth displaying underneath it.
The problem is rarely the technology
Almost every plant that has attempted digitalisation has a similar story.
There was a project. There was a budget. There was a carefully built dashboard.
A few months later, people were back in spreadsheets.
The cause is rarely that the technology was not sophisticated enough.
Far more often, the order was wrong.
Digitalisation frequently starts at the most visible layer. Dashboards, reports, visualisation.
That part presents well to management.
But a dashboard does not produce data. It displays data that already exists.
If production numbers are still collected by hand at end of shift, a dashboard only makes the same figures look more authoritative.
It does not make them any more true.
The sequence that tends to work
Digitalisation that survives almost always follows the same order.
The reason is simple. Each layer is a precondition for the one above it.
Stage 1. Shop-floor data becomes readable.
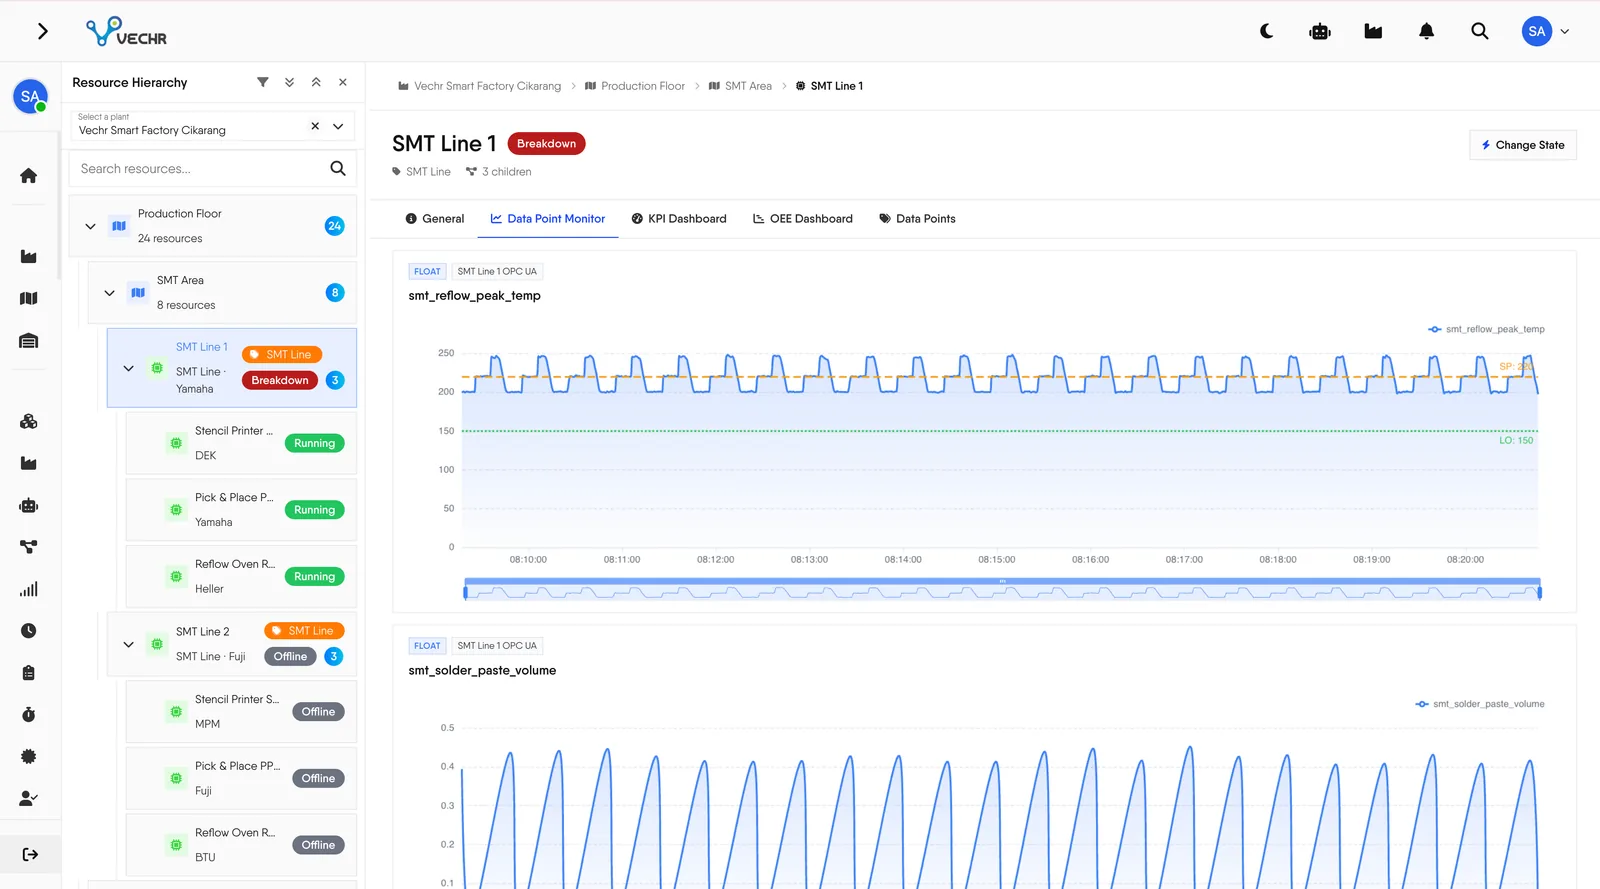
Equipment emits state, counts and process values over a protocol a system can read. OPC UA, MQTT, or Modbus TCP.
No analytics at this stage. What gets built is the ability to know a machine’s condition without a person reporting it.
Stage 2. Production execution is recorded as it happens.
Production orders, material consumption, process steps and inspection results are captured at the moment of the event.
Not reconstructed at end of shift.
This is the stage that changes how people work, and the one most often underestimated.
Stage 3. Analytics is built on data worth analysing.
OEE, traceability and downtime analysis only mean something when their source is real events.
This is where a dashboard finally earns its place, because what it shows is no longer the product of manual collection.
Stage 4. Automation and prediction.
Automated workflows, early warnings and predictive models need a consistent data history.
Without stages 1 to 3, there is no history to learn from.
The order cannot be skipped.
Jumping to stage 4 on stage 0 data is the most common way to spend a budget without result.
Why stage two gets skipped
Stage 1 feels like technical work. Wire up a connection, read the tags, done.
Stage 3 feels satisfying. There is something to look at and something to present.
Stage 2 sits between them, and it is the part that changes people’s habits.
Recording execution as it happens means operators interact with the system while working, rather than filling in a form afterwards.
That demands an interface fast enough not to slow production.
It also demands a willingness to change working practices that have run for years.
Because it is hard, this stage often gets skipped in the hope that equipment data alone will do.
But equipment data only answers what happened to the machine.
It does not say which order was running, which material lot was consumed, who the operator was, or which process step it was.
Without that context, OEE cannot be traced to a cause and traceability never forms at all.
Assessing readiness without a consultant
A few questions are honest enough to place your plant on the ladder.
| Question | If the answer is no |
|---|---|
| Can you tell a machine’s current state without asking a person? | You are at stage 0 |
| Can you tell which order is running on that machine? | You are at stage 1 |
| Can you trace a batch back to its material lots in minutes? | Stage 2 is not finished |
| Is OEE calculated by a system rather than assembled by hand? | Your analytics is not standing on data |
| Has anything on the floor changed because of that number? | You have a dashboard, not digitalisation |
The last question decides the most.
A system that produces numbers but changes no decisions is a cost, not an investment.
The government also provides INDI 4.0 as an official assessment framework within the Making Indonesia 4.0 roadmap.
That framework is useful for reporting and benchmarking between companies.
The questions above are useful for deciding what to do next week.
Start at the constraint, not at the easy line
The strongest temptation in a digitalisation project is to start with the line that is easiest to connect.
Usually the one with the newest machines.
Unfortunately that line is rarely the constraint.
Connecting it produces tidy data about the part that is not causing problems, and no decision changes as a result.
The more useful approach is to start with the one line that genuinely limits output.
Scope stays small, but the result connects directly to something management already cares about.
The numbers coming out of that stage are usually enough to justify the next one.
And that is what decides whether the project continues or stops after phase one.
On older machines
The most common objection sounds like this. “Our machines are too old to connect.”
In practice, age is rarely the deciding factor.
What matters is whether the machine can emit data.
Plenty of machines over a decade old already have PLCs supporting Modbus TCP. Newer ones generally support OPC UA.
Both can be read without changing anything on the machine itself.
For machines with genuinely no data interface, external sensors can capture basic signals. Counters, current sensors, vibration sensors, reporting running, stopped, and unit count.
That does not give the same depth. But it is enough to calculate availability and detect downtime, at a cost far below replacement.
The more common obstacle is not the machines but the network in the production area.
OT network segmentation, undocumented cabling and unmanaged switches usually consume more time than connecting to the machines does.
Where VECHR MES fits
VECHR MES is built to occupy stages 1 through 3 on one platform.
Connectivity, execution and analytics do not become three separate projects that have to be joined together afterwards.
IIoT connectivity is native at the resource level over OPC UA, MQTT and Modbus TCP. Existing equipment can be connected without replacement, provided it speaks one of those protocols.
Production execution is recorded as it happens, with the order, material, operator and process step attached. That context is what makes equipment data traceable to a cause.
OEE, MTTR and MTBF are computed continuously from the same source.
Deployment can start with a single plant or a few lines and grow, so initial scope can stay small without locking the architecture out of later stages.
Choosing a platform is covered further in choosing MES software.
Frequently Asked Questions
What is Making Indonesia 4.0?
Making Indonesia 4.0 is a roadmap launched by the Ministry of Industry in 2018 to drive Industry 4.0 adoption across Indonesian manufacturing, with a set of priority sectors. The government also provides INDI 4.0 as an index for assessing company readiness. Sector lists and programmes evolve, so consult the Ministry of Industry directly for current details.
How long does a factory digitalisation project usually take?
It depends on scope, but the healthy pattern is incremental. Connecting one line and getting trustworthy equipment data generally runs in weeks. Digitising production execution on that line runs in months. Projects designed to finish across an entire plant in a single phase are the ones that most often slip.
Do old machines have to be replaced?
Usually not. Age is rarely the deciding factor. Whether the machine can emit data is. Machines with a PLC speaking Modbus TCP or OPC UA can generally be connected as they are. Machines with genuinely no data interface can be fitted with external sensors, at a cost almost always far below replacement.
Why do so many digitalisation projects stall at the dashboard?
Because the dashboard is the easiest part to build and the easiest to present. But a dashboard only displays data that already exists. If shop-floor numbers are still collected manually at end of shift, a dashboard makes the same numbers look more convincing without making them more accurate.
Where should we start with a limited budget?
Start with the one line that constrains output. Connect its equipment data, calculate OEE from that data, and see where production time actually goes. That scope is usually enough to produce a number that justifies the next phase, and small enough to finish before organisational attention moves elsewhere.